John Bogle’s First Principle of Investing Reversion towards the Mean is a Mathematical concept dictating that as the frequency of an event increases; its Actual Outcome is more likely to match its Theoretical outcome.
Example: Toss a Coin one time, it is random whether it could be Heads or Tails, toss it 5 times and you could easily get 5 heads, toss it 1,000,000 times and each toss remains random, however results are likely to be closer and closer to 50/50 between heads and tails with each toss.
Application for Passive Investors: Keep buying a stock blindly, and you will eventually reach an averaged price that factors out other variables. By slowly and consistently adding to your position, regardless of the current price you will eventually find yourself owning the stock at an average price that is proper to its value.
Positives and Negatives: This strategy will mean that you are buying a stock at a range of prices, some would be higher and some lower, you are not allowed to decide when to buy (this is called Timing the Market) so sometimes you will be buying at a rate higher than what would be considered a value point.
When looking at the price of an individual stock, a sector, or an entire Index there are a plethora of tools available to track where the price is relative to any number of benchmarks – basically you can see if it is cheap, or expensive some of the useful ones to consider would be Moving Averages.
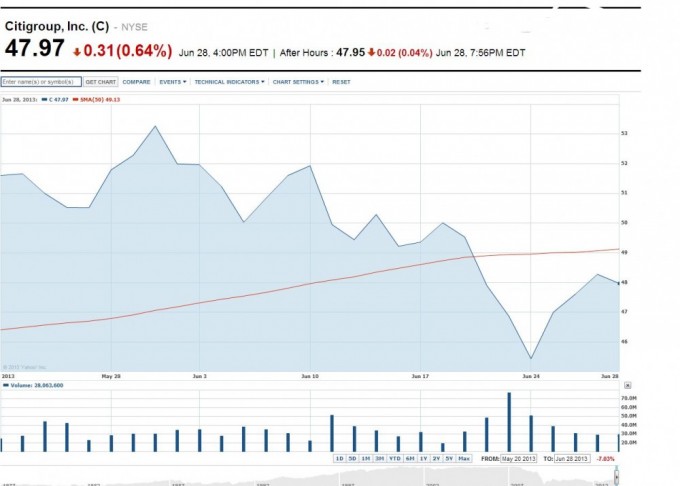
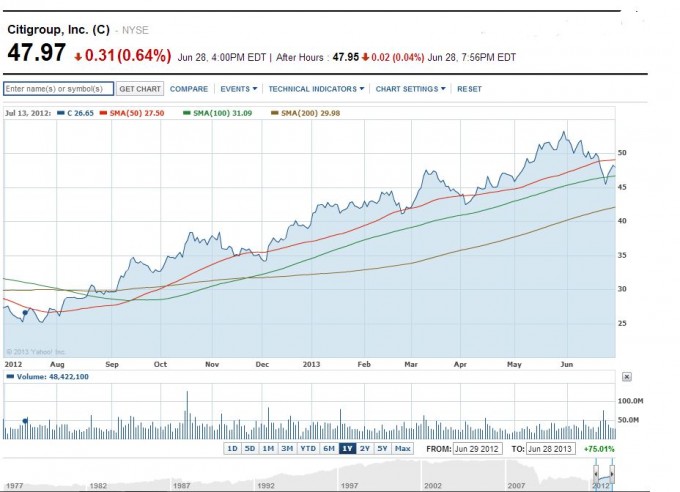
Moving Averages are typically tracked in increments of 50,100 or 200 Days, and their purpose is to show the relative value of the Equity in relation to itself – here are the moving averages for Citibank over these periods, the equation we should consider for the Simple Moving Average would be:
Closing Stock Price/Number of Days in Range

It becomes quite easy to understand the Simple Moving Average when they are considered alone – EG if we look at the 50 Day Simple Moving Average over a 50 day period it is very straight forward, however charting allows us to also consider the same metric of 50 days over a longer period, and layer it with the 100 day and 200 day averages, thus allows us to compare the three averages and potential spot more trends. The Simple Moving Average can be used for many things, but at its simplest level can help show where the present price is relative to its price over the specified period of time.

When the Simple Moving Average is below the current stock price we can see that in recent times the stock has increased in value, IE it was cheaper just a short while ago, and is now more expensive relative to itself. There are lots of factors that influence this price, both internal (such as quarterly performance results, forecasts for upcoming growth etc) and external (such as changing interest rates or supply/demand factors) so if we are aware of them, and still see the price is higher than average it is likely that more money has entered the position, and to buy this equity will now be more costly.
To a Passive Investor none of this matters; in essence they get their paycheck every month and X dollars is assigned to purchasing that equity, regardless of the current price. Clearly this is a good way to get to some sort of generic ‘average’ but it could hardly be considered an efficient purchasing method, as they are willing to arbitrarily buy a position regardless of price.
An Active Investor can allot the same amount of money to investing every month, but opt to purchase, or not purchase based upon any factor they deem relevant, such as Simple Moving Averages, Beta, Price/Earnings Ratio, or any other metric that may or may not be relevant.
The argument against this decision making (that comes from Passive Investors and ‘Bogleheads’ – named after Mr. Bogle) is that it is impossible to accurately predict when the price will be low or high, as you need a crystal ball to see the future and the price today relative to the price tomorrow. Whilst there is truth in that the argument fails because a Passive Investor will buy the equity at any price and if it is the same equity, then buying it at any price cannot be better than buying it at the price you like. It could randomly be better or worse, but it cannot be decidedly worse because it is the same equity, that moves through the same range whether I buy it blindly, or with an attempt at skill.
The key here remains buying incrementally rather than attempting to buy everything in one ‘low’ swoop and selling at one ‘high’ point. If you buy monthly or quarterly using either a Passive or Active approach to the investment the benefits of Dollar Cost Averaging will still regress the purchase to the mean, and perhaps more efficiently if done with some strategy.
This concludes Part one of John Bogle’s 10 Principles, and the first of his Principles of Investing, the Reversion towards the Mean is clearly something that is not tied to either a Passive or Active Investment strategy. It is instead something that is linked to Dollar Cost Averaging your Investments over time, regardless of strategy. This is a good thing, as it means we can take it and apply it as we see fit.
Leave a Reply