For the past year or two, I’ve been very interested in data visualization. I first started playing with D3, which is a visualization tool, and later evolved into looking at data management tools such as The R Project. I’m still quite a beginner at it, but I can see the applications.
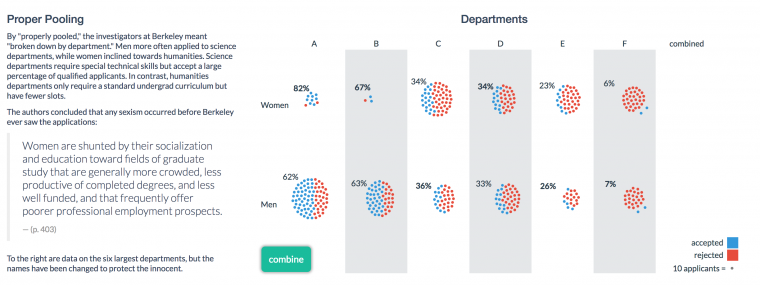
There’s a symbiotic relationship with these two types of tools. One allows you to manipulate data, with a variety of queries, and the other allows you to present the results. In short, it’s like a more powerful spreadsheet and charting tool – the spreadsheet aspect having more database like characteristics, allowing you to build objects. Here’s a nice example of data presented in this manner, with the link being interactive.
Interactive Link> Vudlab/Simpsons (source)
The High Level Process
Gather Data
Whether you are using a Spreadsheet, Database or R like tools, you need to ‘feed the beast’. Data can be sourced in various ways. Here’s an article from the Open Data Institute (ODI) on data gathering methods for R. Typically, the methods revolve around how to gather acceptable file types, which are often in .CSV format, and then load them into R for manipulation.
A good example for illustration is the following code snippet:
read.url("https://www.gov.uk/government/uploads/system/uploads/
attachment_data/file/246663/pmgiftsreceivedaprjun13.csv")
This would (in theory) search the Gov.UK website for a file uploaded to their server. The .CSV appendage implying that it is a data file. Here’s an example of how you would do this on Saverocity to find an image file:
https://saverocity.com/travel/wp-content/uploads/sites/9/2016/10/Screen-Shot-2016-10-26-at-7.58.10-PM.png As you can see the last three characters here are .png (an image file).
The R command read.url isn’t unique to programming, and would pull that file into the R development environment for direct manipulation. The ‘Travel Hacking’ application of this knowledge would be if you could find the CSV files of airline award programs, you could start ‘manipulating’ the data on a larger level.
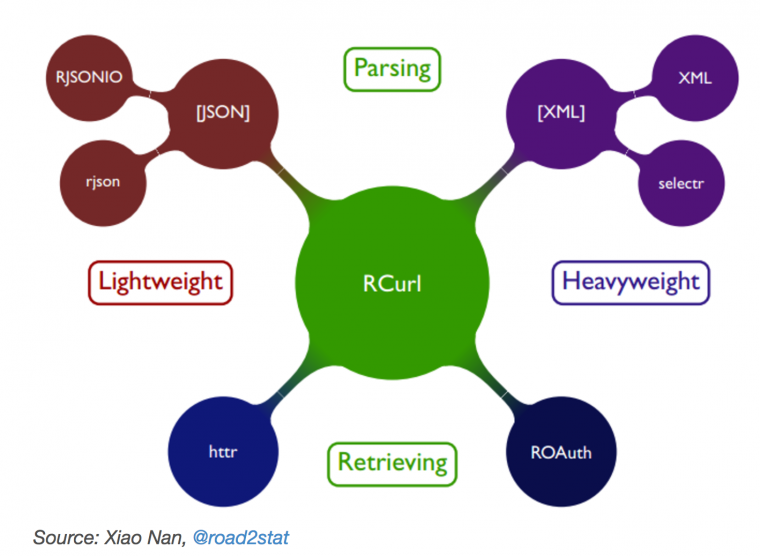
The downside to grabbing files on an award program by program basis is that it would take more time to source the code, and to find a way to access it, as you might need to deploy more sophisticated methods to access the files. The same ODI article discusses scraping tools within R, such as those developed by Xiao Nan, which makes use of a Curl command, along with some other tools.
Why DIY when you can API?
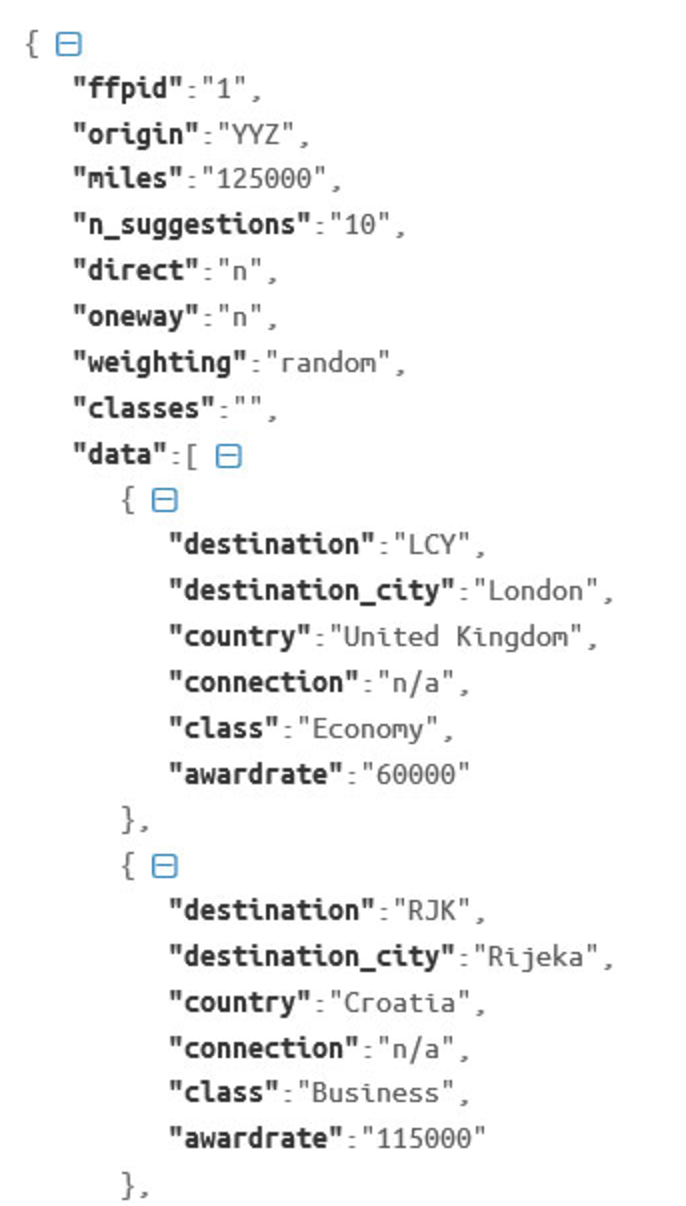
While the above tools and commands greatly increase productivity, they are still somewhat manual and laborious. The alternative solution would be to access a repository of data that already exists, and work from there. Miles.biz, for example, has an API that allows you to access their data for a monthly fee. People who want to build an award maximisation tool for their website might use something like this, allowing people to search between point A and point B.
What difference would visualization make?
The current approach to maximising your miles is to search your trip, and be offered a list of results, showing the lowest priced program for the routing. This is a very helpful tool for those planning a trip to a determined destination, but it lacks a couple of very important, if dangerous, factors.
For example, searching JFK-IST would provide you with a list of outputs, but it wouldn’t show you if a nearby airport was unusually cheaper. It’s very linear in it’s thinking. However, if you were to load all award programs into a data manipulation tool, and start adding in additional DOM characteristics, you might find unusual answers.
The big difference though, is that you’d have to run normalized queries on a broader scale, starting at large targets – for example: searching JFK-NRT, and printing out a chart that showed the cheapest routing, and then sub charts of the cheapest routing if you adjusted origin/destination by a certain amount of distance.
Normalization
The key to creating a usable model would be to normalize the data within each program. The most logical approach to this would be using homogeneous geolocation field, using the longitude and latitude of the airport code would allow someone to then add in a radial distance for search parameters. This is an important step because you need to be able to compare distance based award charts (which might have delimited distances differently) with region based award charts, which might decide to divide South America into two zones, or not, or draw the line between zones slightly differently.
Stackoverflow discusses how R would allow you to compute the distance between objects using the following command package:
library(geosphere) distm (c(lon1, lat1), c(lon2, lat2), fun = distHaversine)
A very powerful, if controversial normalization would occur within the value of an award ‘mile’. This might be so subjective that allowing user entry would be preferable. The essence of normalizing here would revolved around acquisition cost of a mile in relation to other miles. You could then add a weighting to each mile to create a relative scale.
Applications and Searches
The key to maximising this would be a balance between innovative searches, and visual outputs. A simple query that could be considered from the above data might be:
- Divide Distance by Weighted Mile.
The output of this query would identify the best value for the traveler who wished to fly the furthest distance for the lowest price. This would show sweet-spots across all award programs, which could go from the innocent (a reasonable fair from A>B) to the unusually generous (25,000 miles for 9hrs in Business Class). Because all the data is already accessed, this would allow you to run thousands of queries in one command, rather than searching JFK-NRT, loading, waiting… and so on.
Data integrity here is key. If you took the faster, and easier, approach of API to grab the base data, you’d have to know how that data was actually constructed. If Miles Biz looked at a generic zoning chart that stated Turkey was in Middle East 1, and then added in all Turkish airports to Middle East 1 pricing, it wouldn’t be as useful as actually having data pulled from the underlying award program CSV. It would still show bargains, but not all of them.
Remember – the API would be used for accurate data population rather than logic rules, so if corners were cut to follow the rules too closely when building the API Client data, it would be lessened.
Distance Based Anomaly Searching
I think it was TravelisFree who talked about breaking a route via Hawaii in order to move from North America to Asia/Oceania using British Airways Avios. The concept here is that in a distance based zone chart, you might find a scenario where:
- Origin>Midpoint = Zone 2
- Midpoint>Destination = Zone 3
- Origin> Destination = Zone 5
- Where sum(Zone 2+ Zone 3)< Zone 5
If you combined the base data with routing rules and logic, you could search across all programs and run a query in the same manner that people use ITA Matrix for hidden cities. This would be something like:
- Origin
- Destination (abc,xyz,fff,etc)
- Stop (True Destination)
Routing rules might be complex, but mostly could be included via some basic logic, involving a distance from origin/destination equation for a True/False output.
Alternative Airport Suggestions
The ability to add in a search parameter for nearby airports exists already, but rules might prevent it from crossing boundaries of regions. Having a distance based search that wasn’t bound by award program logic might open up new opportunities.
Conclusion
There’s a lot more applications that could be built from the above, but the problem is that as soon as it was built, it would self destruct. We circle back to the volume/exploitation issue that always arises in the travel hacking world… if it is too easy (and it doesn’t get easier than visual) then it will be overloaded.
That said, I really dislike the idea that everyone currently does manual searches and then talks in code, since it is a tremendously inefficient system… but perhaps the only one that allows broader group collaboration. This is a key reason why I suggest people share (to an extent) within semi private areas, like Level 2 of the Forum, but they use this to prove bona fides to evolve into smaller groups who are capable of tackling a project like this, and perhaps keeping it just to 6-10 people.


Leave a Reply