An average is given to a series of numbers for us to attempt to make order from chaos. There are several ways to calculate an average, though the term is most commonly associated now with the arithmetic mean. This mean is calculated as the sum of numbers divided by the number of numbers in a series. Other forms of average are the mode and median. When it comes to investments averages become more sophisticated, taking into account both the pattern of the numbers, and how adding (and withdrawing) from the investment at certain times will impact the return.
This post will explore averages, from the arithmetic mean, to the geometric mean (time weighted return) and the money weighted return.
Calculating a simple return
An investment of $10,000 is worth $14,000 after two years, what is the average return?
However, we need averages for variable annual returns, and the arithmetic mean is not the best choice for forecasting:
Calculating average return from variable annual returns
Investing $10,000 at the start of year 1
The arithmetic mean of these two number is 18.5%. If you invested $10,000 at a fixed 18.5% your investment would be worth:
The Geometric Mean
To calculate the geometric mean we then apply the following calculation to the returns: [Year 1 return*Year 2 return] √2. Note that the divisor is the number of periods, so if we were looking at 5 years it would be (Y1*Y2*Y3*Y4*Y5)√5. Back to our example:
(1.25)*(1.12)√2 = 18.32%
Using this number, we get the following progression
The Money Weighted Return
The money weighted return studies cashflows to and from the investment. IE it looks at the investment in relation to how you invest in it. If we were to look at that same time weighted example, while it ‘averaged’ an 18.32% return from the geometric mean, and 18.5% from the arithmetic mean, it still earned 25% in year 1 and 12% in year 2.
With that in mind, if you had put money into the investment in different ways, you would have seen a different result. Examples:
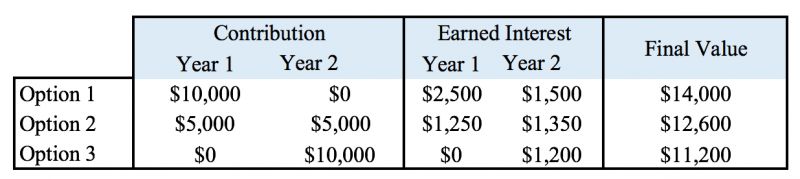
Money Weighted Returns
So, what you can see here is that you can average a return with some accuracy by using the geometric mean, which gives an average for the investment, but that same investment can offer a different return to different people depending on how and when they invest.
The role of Standard Deviation
Averages without standard deviation can be misleading. If we know the standard deviation, we are able to make a risk assessment more accurately. If we look at arithmetic mean, we can see this in action:
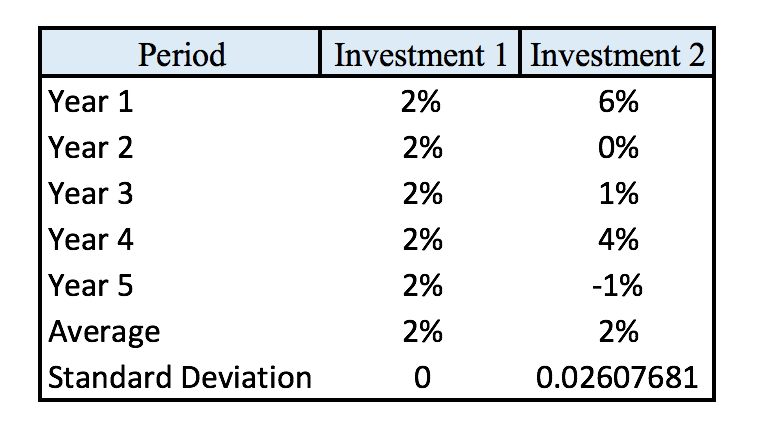
Standard Deviation
So while both Investment 1 and Investment 2 share a common ‘average’ there is a lot more to consider about the two when you consider the dispersion around that average. Investment 1 here is reflective of a fixed income product, such as a bond, whereas Investment 2 is a good reflection of a highly volatile equity, likely a single stock. The standard deviation introduces risk when we consider the money weighted return, because if we buy in after Year 1 in the above example, the average return would be 1 ( or 0.73% geometrically). This concept of risk and reward from average returns is the essence of modern portfolio theory.
The post Understanding averages and investment returns appeared first on Saverocity Finance.
This post will explore averages, from the arithmetic mean, to the geometric mean (time weighted return) and the money weighted return.
Calculating a simple return
An investment of $10,000 is worth $14,000 after two years, what is the average return?
- $14,000-10,000=$4,000/2= $2,000
- $2,000/$10,000 = 20%
However, we need averages for variable annual returns, and the arithmetic mean is not the best choice for forecasting:
Calculating average return from variable annual returns
Investing $10,000 at the start of year 1
- Year 0 = $10,000
- Year 1 = $12,500
- Year 2 = $14,000
- Year 1 growth to $12500 = 25% return (12500-10000)/10000=25%
- Year 2 growth to $14,000 = (14000-12500)/12500=12%
The arithmetic mean of these two number is 18.5%. If you invested $10,000 at a fixed 18.5% your investment would be worth:
- Year 0 = $10,000
- Year 1 = $11,850
- Year 2 = $14,042
The Geometric Mean
To calculate the geometric mean we then apply the following calculation to the returns: [Year 1 return*Year 2 return] √2. Note that the divisor is the number of periods, so if we were looking at 5 years it would be (Y1*Y2*Y3*Y4*Y5)√5. Back to our example:
(1.25)*(1.12)√2 = 18.32%
Using this number, we get the following progression
- Year 0 = $10,000
- Year 1 = $11,832
- Year 2 = $13999.62
The Money Weighted Return
The money weighted return studies cashflows to and from the investment. IE it looks at the investment in relation to how you invest in it. If we were to look at that same time weighted example, while it ‘averaged’ an 18.32% return from the geometric mean, and 18.5% from the arithmetic mean, it still earned 25% in year 1 and 12% in year 2.
With that in mind, if you had put money into the investment in different ways, you would have seen a different result. Examples:

Money Weighted Returns
So, what you can see here is that you can average a return with some accuracy by using the geometric mean, which gives an average for the investment, but that same investment can offer a different return to different people depending on how and when they invest.
The role of Standard Deviation
Averages without standard deviation can be misleading. If we know the standard deviation, we are able to make a risk assessment more accurately. If we look at arithmetic mean, we can see this in action:
Standard Deviation
So while both Investment 1 and Investment 2 share a common ‘average’ there is a lot more to consider about the two when you consider the dispersion around that average. Investment 1 here is reflective of a fixed income product, such as a bond, whereas Investment 2 is a good reflection of a highly volatile equity, likely a single stock. The standard deviation introduces risk when we consider the money weighted return, because if we buy in after Year 1 in the above example, the average return would be 1 ( or 0.73% geometrically). This concept of risk and reward from average returns is the essence of modern portfolio theory.
The post Understanding averages and investment returns appeared first on Saverocity Finance.