That’s fine though, failure is needed on the path to success. If you feel strongly about this I advise you to:
You should not accept anything that is written as the truth, you should seek to challenge it. In the end you will either confirm your hypothesis or refine it. Either way is a win.
Here goes…. do you agree with this flowchart?
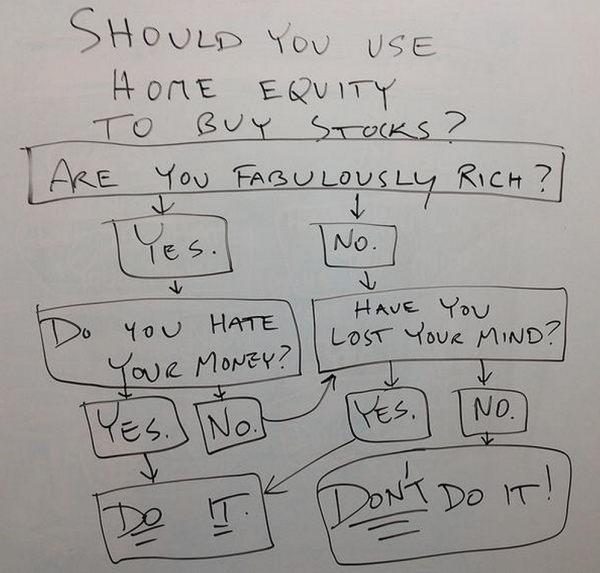
Equity Flowchart
This flowchart is something everyone seems to agree with. But it shows a massive disconnect of financial intelligence. The problem: Most people who are invested in stocks have debt. It might be in the form of overt debt, such as a loan (Mortgage, Student Loan etc) or covert, such as an obligation to assist a child through college or a parent through retirement.
The chart here says it is clearly ‘silly’ to take out home equity to invest in stocks. But that is really saying you should not invest in stocks while you have debt. Too tantric for you? Let’s look at home equity as a concept first.
The home appreciates to $600,000. Equity is now $300,000, loan is $300,000. 50:50 ratio. Advice is ‘don’t take out equity to buy stocks’. Everyone agrees.
Example 2 (why this chart is illogical)
A person who cannot afford a home purchase has no home equity, therefore can invest in stocks.
Example 3 (another example – using me)
My equity ratio is 100:0. If I pull out a a chunk of money, my home equity ratio will still be better than a person starting out. I’ll have a mortgage, and a let’s say $200K in cash.
What advice would you give?
If you saw a person with a reasonable equity:debt ratio, and say $200K in cash, would your advice be ‘you should NOT invest in stocks, you MUST pay down your mortgage!’ or would you instead compare opportunities for the money?
Let’s take this further… lets compare two hypothetical people:
This flowchart states that if Person B was to become Person A he would be an idiot… in that case, we can surmise that according to this chart you should not be invested in stocks until your mortgage is paid off in full.
Now, I’m not saying whether I agree with that or not, but you should ask yourself, if you think that flowchart is so awesome, what are you really saying…
Conclusion
This is a massive financial concept. It ties into my talk at TravelCon about being able to view financial decisions holistically, and not in isolation. If you look holistically at Person A and B in the final example their net worth is identical. As such, if one cashed out equity from their home they would still appear to be in a strong financial position.
The holistic view in this example should compare opportunity cost between low cost borrowing and high risk investing. The correct path will be subjective, but not as silly as that flowchart makes it appear. For that reason, this flowchart is silly. It looks only at your home as an investment vehicle and doesn’t consider overall wealth. Once we understand these concepts we can decide when investing in stocks is a good idea.
The post If you fail this test, you don’t understand money. appeared first on Saverocity Finance.
Continue reading...
- Argue.
- Listen.
- Change.
You should not accept anything that is written as the truth, you should seek to challenge it. In the end you will either confirm your hypothesis or refine it. Either way is a win.
Here goes…. do you agree with this flowchart?
Equity Flowchart
This flowchart is something everyone seems to agree with. But it shows a massive disconnect of financial intelligence. The problem: Most people who are invested in stocks have debt. It might be in the form of overt debt, such as a loan (Mortgage, Student Loan etc) or covert, such as an obligation to assist a child through college or a parent through retirement.
The chart here says it is clearly ‘silly’ to take out home equity to invest in stocks. But that is really saying you should not invest in stocks while you have debt. Too tantric for you? Let’s look at home equity as a concept first.
- A home is not an investment. It is a vehicle for storing equity and debt. Fringe benefits of ownership is shelter need. Frequently, home owners in start out with an equity:debt ratio of around 25:75. That means on a $400,000 home you put $100,000 down and borrow the remainder as mortgage.
- If the home appreciates in value by $100,000 the equity is now $200,000, the loan remains $300,000 and the equity:debt ratio has become 40:60.
- If the home depreciates in value by $100,000 the equity is now zero and the loan remains $300,000. The equity:debt ratio is 0:100. Should the price depreciate any further the loan is considered ‘under water’ because the loan is more than the resale value of the property.
The home appreciates to $600,000. Equity is now $300,000, loan is $300,000. 50:50 ratio. Advice is ‘don’t take out equity to buy stocks’. Everyone agrees.
Example 2 (why this chart is illogical)
A person who cannot afford a home purchase has no home equity, therefore can invest in stocks.
Example 3 (another example – using me)
My equity ratio is 100:0. If I pull out a a chunk of money, my home equity ratio will still be better than a person starting out. I’ll have a mortgage, and a let’s say $200K in cash.
What advice would you give?
If you saw a person with a reasonable equity:debt ratio, and say $200K in cash, would your advice be ‘you should NOT invest in stocks, you MUST pay down your mortgage!’ or would you instead compare opportunities for the money?
Let’s take this further… lets compare two hypothetical people:
- Person A buys a house with 33% downpayment ($100K) and has $200K in stocks
- Person B buys a house with 100% cash ($300K) and has no stocks.
This flowchart states that if Person B was to become Person A he would be an idiot… in that case, we can surmise that according to this chart you should not be invested in stocks until your mortgage is paid off in full.
Now, I’m not saying whether I agree with that or not, but you should ask yourself, if you think that flowchart is so awesome, what are you really saying…
Conclusion
This is a massive financial concept. It ties into my talk at TravelCon about being able to view financial decisions holistically, and not in isolation. If you look holistically at Person A and B in the final example their net worth is identical. As such, if one cashed out equity from their home they would still appear to be in a strong financial position.
The holistic view in this example should compare opportunity cost between low cost borrowing and high risk investing. The correct path will be subjective, but not as silly as that flowchart makes it appear. For that reason, this flowchart is silly. It looks only at your home as an investment vehicle and doesn’t consider overall wealth. Once we understand these concepts we can decide when investing in stocks is a good idea.
The post If you fail this test, you don’t understand money. appeared first on Saverocity Finance.
Continue reading...